Monday, January 22, 2018

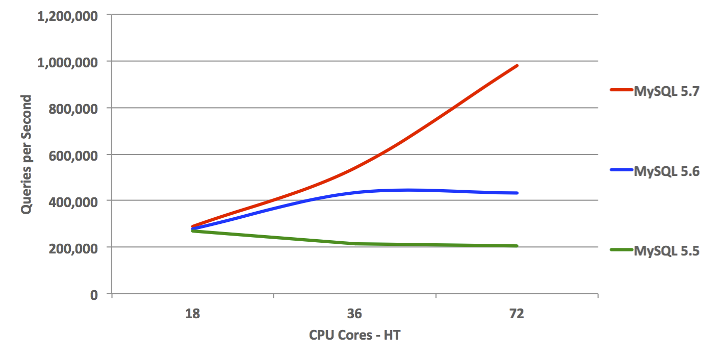
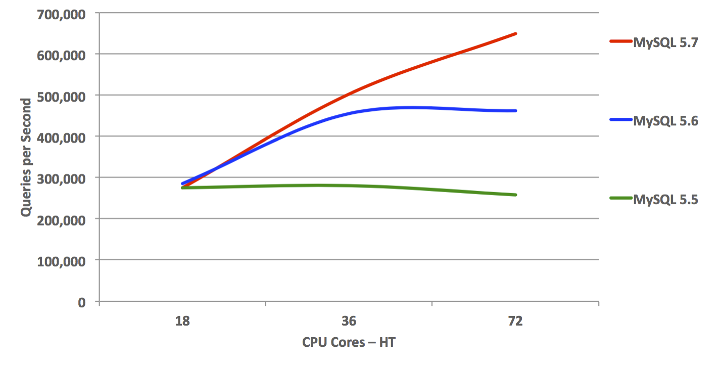
MySQL 5.7 vs 5.6 vs 5.5 : Sysbench Benchmark

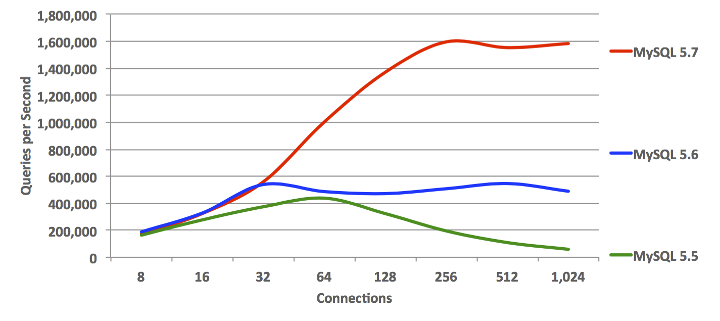
MySQL 5.7 Sysbench Benchmark: SQL Point Selects

MySQL 5.7 Sysbench Benchmark: SQL Point Selects

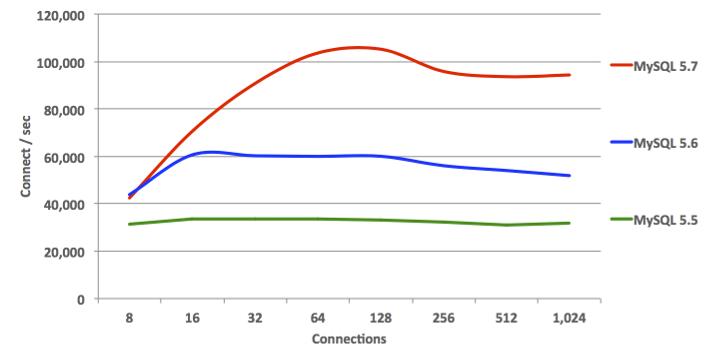
MySQL 5.7 Sysbench Benchmark: Connection Requests

MySQL 5.7 Sysbench Benchmark: Connection Requests

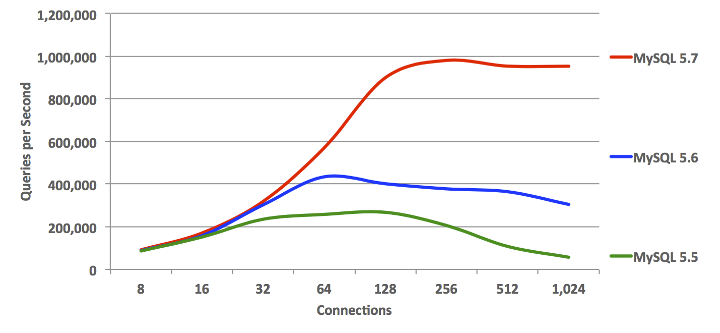
MySQL 5.7 Sysbench Benchmark: OLTP Read Only

MySQL 5.7 Sysbench Benchmark: OLTP Read Only

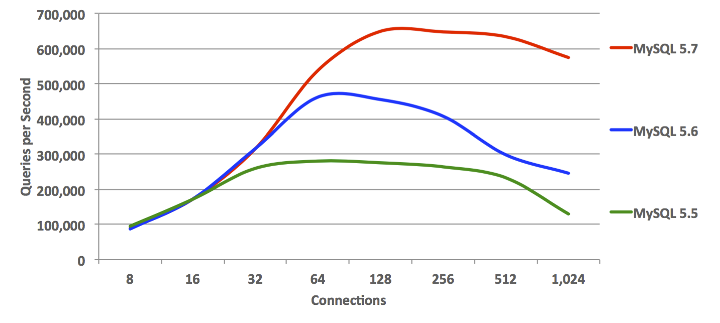
MySQL 5.7 Sysbench Benchmark: OLTP Read Write

MySQL 5.7 Sysbench Benchmark: OLTP Read Write

MySQL Scales Beyond 72 CPU Cores-HT: OLTP Read Only

MySQL Scales Beyond 72 CPU Cores-HT: OLTP Read Only

MySQL Scales Beyond 72 CPU Cores-HT: OLTP Read Write

MySQL Scales Beyond 72 CPU Cores-HT: OLTP Read Write

Friday, January 19, 2018

Rules of Thumb for MySQL

SELECTs -- do's and don'ts

RoTsDiscussion

    ⚈  Do not hide an indexed column inside a function call: DATE(x) = '...' or LCASE(col) = 'foo'

    ⚈  LCASE() is usually unnecessary because the collation will compare 'correctly' without it.

    ⚈  Subqueries usually perform poorly; try to turn into JOIN. ↣

    ⚈  Usually IN (SELECT...) optimizes poorly. Turn into JOIN. (5.6.5 improves) ↣

    ⚈  A subquery that condenses data (GROUP BY, LIMIT, etc) may perform well

    ⚈  OR may be very inefficient; turn into UNION.

    ⚈  A coding pattern:
dt >= '2010-02-01' AND dt < '2010-02-01' + INTERVAL 7 DAY

    ⚈  WHERE (a,b) > (7,8) is poorly optimized

    ⚈  Gather these to study a slow query: SHOW CREATE TABLE and EXPLAIN SELECT .... ↣

    ⚈  Do not use OFFSET for pagination -- continue where you "left off". ↣

    ⚈  Don't mix DISTINCT and GROUP BY

    ⚈  DISTINCT is not a function. ↣

    ⚈  Be explicit about UNION ALL vs UNION DISTINCT -- it makes you think about which to use

    ⚈  Do not use SELECT * except for debugging or when fetching into a hash. (Instead, spell out the columns you need.) ↣

    ⚈  VIEWs are often poorly optimized. ↣

    ⚈  A subquery in the FROM clause may be useful for retrieving BLOBs without sorting them: Speed up a query by first finding the IDs, then self-JOIN to fetch the rest.

    ⚈  Don't splay an array across columns; use another table.
Subqueries came to MySQL rather late in the game. For many years, they were not well optimized, so it is usually better to turn your SELECTs into an equivalent JOIN. This is especially true for IN ( SELECT ... ). Optimization improved some in 5.6.5 and MariaDB 5.5. 5.7 improves more.

Sometimes a subquery is really the best way to optimize a SELECT. The common thread of these "good" subqueries seems to be when the subquery has to scan a lot of rows, but boils down the intermediate resultset to a small number of rows. This is likely to happen with GROUP BY or LIMIT in the subquery.

SELECT DISTINCT(a), b FROM ... is the same as SELECT DISTINCT a, b FROM .... That is, the combination of all the columns are de-dupped, not just the one in parentheses.

For analyzing a slow query, SHOW CREATE TABLE provides the datatypes, indexes, and engine. (DESCRIBE provides much less info.) SHOW TABLE STATUS tells how big the table is. EXPLAIN says how the query optimizer is likely to perform the query. EXPLAIN FORMAT=JSON gives more details. The OPTIMIZER_TRACE can give more.

It is so tempting to use ORDER BY id LIMIT 30,10 to find the 4th page of 10 items. But it is so inefficient, especially when you have thousands of pages. The thousandth page has to read (at some level) all the pages before it. Instead, remember where you "left off"; that is, have the "Next" button on one page give the id (or other sequencing info) of where the next page can be found. Then that page simply does WHERE id > $leftoff ORDER BY id LIMIT 10. More on pagination.

"SELECT *" will break your code tomorrow when you add another field. It is better to spell out the fields explicitly. (There is no noticeable performance difference.)

A VIEW are syntactic sugar around a SELECT. The Optimizer can't do any better with a VIEW than with the underlying SELECT. Sometimes it does worse, though the Optimizer is improving over time.


INDEXing

RoTsDiscussion

    ⚈  Start an INDEX with "="s from the WHERE clause, then one other thing (range, group, order). ↣

    ⚈  Terms: PRIMARY KEY > UNIQUE > INDEX = KEY. ↣

    ⚈  An index may speed up a SELECT by orders of magnitude and will slow down INSERTs a little. (Usually this is a good tradeoff.)

    ⚈  Adding indexes is not a panacea.

    ⚈  BTree is an excellent all-around indexing mechanism.

    ⚈  A BTree index node contains ~100 items. (1M rows = ~3 levels; 1B rows = ~5 levels)

    ⚈  Flags, and other fields with few values ("low cardinality"), should not be alone in an index -- the index won't be used.

    ⚈  MySQL rarely uses two INDEXes in one SELECT. Main exceptions: subqueries, UNION.

    ⚈  A "prefix" index -- INDEX(name(10)) -- is rarely useful. Exception: TEXT

    ⚈  A UNIQUE "prefix" is probably wrong -- UNIQUE(name(10)) forces only 10 chars to be unique.

    ⚈  It is ok to have Index_length > Data_length.

    ⚈  5 columns in a compound index seems "too many"

    ⚈  Having no "compound" (aka "composite") indexes is a clue that you do not understand their power. INDEX(a,b) may be much better than INDEX(a), INDEX(b)

    ⚈  The columns in a composite index are used left to right.

    ⚈  INDEX(a,b) covers for INDEX(a), so drop the latter.

    ⚈  ORDER BY a ASC, b DESC cannot use INDEX(a ASC,b DESC); 8.0 fixes this

    ⚈  2x speedup when "Using index" (a "covering" index). ("Using index condition" is a different animal.) ↣

    ⚈  2 out of 3 tables have a perfectly good "natural" PRIMARY KEY, so AUTO_INCREMENT is not necessary.

    ⚈  FULLTEXT -- watch out for min_word_len, stopwords, and 50% rule. MyISAM and InnoDB have differences.

    ⚈  A FULLTEXT index will be used before any other index.

    ⚈  FULLTEXT -- consider Syphinx, Lucene, Solr, etc (3rd Party).
Indexing is very important to any database. Getting the "right" index can make a query run orders of magnitude faster. So, how to do that? Often "compound indexes" (multiple columns in a single INDEX(...)) are better than single-column indexes. A WHERE clause that has column=constant begs for an index that starts with that column. If the WHERE clause has multiple fields AND'd together, "="s should come first.

INDEXes are structured in BTrees. The "root" node (a block) of a BTree has pointers to child blocks. This goes as deep as necessary, but really not very deep (see the 100x RoT). MyISAM uses 1KB blocks; InnoDB uses 16KB blocks.

Each INDEX is its own BTree. A PRIMARY KEY is a UNIQUE key is an INDEX. INDEX and KEY are synonomous. In InnoDB, the data is included in the BTree for the PRIMARY KEY. In MyISAM, the data is a separate file (.MYD).

A "covering" index is one where all the fields needed in a SELECT are included in the INDEX.

Index Cookbook
(That includes tips on many:many mapping table and wp_postmeta.)


ENGINE Differences

RoTsDiscussion

    ⚈  InnoDB is faster than MyISAM -- contradicts the 'old' wisdom; InnoDB has improved. ↣

    ⚈  Use InnoDB instead of MyISAM. MyISAM is going away, not supported, fragile, etc. ↣

    ⚈  2x-3x bigger disk footprint for InnoDB than MyISAM

    ⚈  When converting from MyISAM to InnoDB, do learn the differences in INDEXes, especially the PRIMARY KEY.

    ⚈  A secondary index in InnoDB implicitly includes the PRIMARY KEY.

    ⚈  An InnoDB table should have an explicit PRIMARY KEY, even if it is an artificial AUTO_INCREMENT.

    ⚈  "Rows" and "Avg_row_length" (SHOW TABLE STATUS) may be off by a factor of 2 (either way) for InnoDB.

    ⚈  For MyISAM, don't OPTIMIZE TABLE unless there is more than 10% Data_free according to SHOW TABLE STATUS

    ⚈  For InnoDB, don't OPTIMIZE TABLE -- it is rarely of any use (and it turns into an ALTER)

    ⚈  Don't let a BEGIN...COMMIT last more than a few seconds. ↣

    ⚈  Use BEGIN, not autocommit=0 -- it is less confusing.
MyISAM dates back to the '90s. It was designed to be simple and fast, while lacking important database features (ACID). Since InnoDB came along in the '00s, most energy has gone into improving it. Today, InnoDB, (and Percona's Xtradb) are excellent engines. InnoDB recovers automatically after a crash.

MyISAM's simplicity leads to very little overhead on disk. InnoDB's transactional semantics, MVCC, ROLLBACK, undo, etc, lead to a lot of disk overhead. Some can be mitigated, but it is a tradeoff between speed and robustness.

MyISAM caches INDEX blocks in the "key_buffer". Data blocks are cached by the Operating system. InnoDB caches both data and indexes in the "buffer_pool". These lead to radically different tuning (see 70% RoT).

With InnoDB, either use autocommit=1, making each operation into a "transaction", or use BEGIN (START TRANSACTION) and COMMIT to explicity bracket each set of statement(s) that make up a transaction. InnoDB can prevent many kinds of "deadlocks", and simply stall one transaction until it is safe to continue. Some deadlocks are easily detected after starting transactions, and lead to aborting one of the competing transactions; this ROLLBACK must be monitored for by the application. Still other situations can lead to hanging until a timeout. innodb_lock_wait_timeout, which defaults to 50 seconds. 50 is too large.

MyISAM to InnoDB conversion tips

Galera Tips
Galera and Group Replication have other transactional implications.


Optimizations, and not

RoTsDiscussion

    ⚈  "Using Temporary" and "Filesort" are not the end of the world. And, often they are unavoidable.

    ⚈  Might even get 2 Filesorts: GROUP BY x ORDER BY y

    ⚈  Avoid using index hints (USE / FORCE / IGNORE / STRAIGHT_JOIN) ↣

    ⚈  You cannot "tune your way out of a CPU problem"; instead, rethink the slow queries.

    ⚈  Do not strive for "Fixed" length rows in MyISAM. Usually it makes performance worse (by increasing I/O).

    ⚈  If more than 20% of the rows are needed, a table scan is faster than using the obvious INDEX. (This RoT usually explains why "the optimizer did not use my index".) ↣

    ⚈  key-value stores perform poorly. Toss most k-v into a JSON blob. ↣

    ⚈  For fast loading use LOAD DATA or batched INSERTs. ↣

    ⚈  Use 100-1000 rows per batch INSERT (10x speedup). (Important to limit in Replication) ↣

    ⚈  Similarly, DELETE in chunks of 1000. ↣

    ⚈  Rows clustered together are 10x faster to access than random rows (fewer blocks to fetch)

    ⚈  SHOW CREATE TABLE is more descriptive than DESCRIBE.

    ⚈  innodb_flush_log_at_trx_commit = 1 for safety; = 2 for speed (often a lot of speed). RAID with battery-backed cache can use 1 (and be fast). Galera can use 2 (use SST for recovery).

    ⚈  How seriously to take optimization? 1K rows: yawn; 1M rows; serious; 1B rows: all of these tips, plus more.

    ⚈  "Profiling" a query is rarely useful.
Index hints (FORCE INDEX, etc) may help you today, but different constants in the WHERE clause may lead FORCE to do the "wrong" thing tomorrow.

If most rows can be eliminated by using an INDEX, then index is the efficient way to go. If not many rows can be eliminated, then the bouncing back and forth between the index and the data is likely to be more costly than ignoring the index and simply scanning the whole table. The 20% is approximate -- 10%-30% seems to be the typical range for the cutoff between the two algorithms.

If you have a flexible number of attributes on a table, and are puzzling over how to build the schema, you might think to use a separate "key-value" or "EAV" table. Or you might add lots of columns, only to stumble over the messiness of adding more columns. Many "NoSQL" competitors try to make this easy. Within MySQL, put all these attributes in a JSON blob. Recommend compressing the blob. (3:1 compression is typical for English text, XML, code, etc.) Make 'real' columns for the important attributes that need to be indexed. BTW, MariaDB has "dynamic columns"; it even allows indexing sparse column hidden in their key-value blob. More discussion of EAV issues and solutions.

If you can arrange for rows to be "adjacent" to each other, then one disk fetch will bring in many rows (10x speedup on HDD; perhaps 4x for SSD).

"Batched" INSERTs are where one INSERT statement has multiple rows. Nearly all of the performance benefit is in the first 100 rows; going beyond 1000 is really getting into 'diminishing returns'. Furthermore, in a Replication environment, a huge INSERT would cause the Slave to get 'behind'.

More on Large Deletes / Updates
Indexing tip for WP's postmeta


PARTITIONing

RoTsDiscussion

    ⚈  Don't use PARTITION until you know how and why it will help. ↣

    ⚈  Don't use PARTITION unless you will have >1M rows

    ⚈  No more than 50 PARTITIONs on a table (open, show table status, etc, are impacted) ↣

    ⚈  PARTITION BY RANGE is the only useful method. ↣

    ⚈  SUBPARTITIONs are not useful.

    ⚈  The partition key should not be the first column in any index.

    ⚈  It is OK to have an AUTO_INCREMENT as the first part of a compound key, or in a non-UNIQUE index. ↣
It is so tempting to believe that PARTITIONing will solve performance problems. But it is so often wrong.

PARTITIONing splits up one table into several smaller tables. But table size is rarely a performance issue. Instead, I/O time and indexes are the issues.

Perhaps the most common use case where PARTITIONing shines is in a the dataset where "old" data is deleted from the table periodically. PARTITION BY RANGE by day (or other unit of time) lets you do a nearly instantaneous DROP PARTITION plus REORGANIZE PARTITION instead of a much slower DELETE.

An AUTO_INCREMENT column must be the first column in some index. (That lets the engine find the 'next' value when opening the table.) It does not have to be the only field, nor does it have to be PRIMARY or UNIQUE. If it is not UNIQUE, you could INSERT a duplicate id if you explicitly provide the number. (But you won't do that, will you?)

The "Data Dictionary" of version 8.0 probably eliminates the 50-partition advice. ("Stay tuned.")

Partition Maintenance (sliding timeframe)


Memory Usage

RoTsDiscussion

    ⚈  70% of RAM for innodb_buffer_pool_size (when using just InnoDB) ↣

    ⚈  20% of RAM for key_buffer_size (when using just MyISAM) ↣

    ⚈  Leave other memory tunables alone

    ⚈  Do NOT let mysql swap

    ⚈  thread_cache_size -- A small, non-zero, number (like 10) is good.

    ⚈  If (Opened_tables / Uptime) > 1/sec, increase table_open_cache.

    ⚈  Turn off the Query Cache: query_cache_type=off and query_cache_size=0. ↣
The 70% and 20% RoTs assume more than 4GB of RAM, the server is mostly for MySQL, and you are not using both engines.

MySQL performance depends on being in control of its use of RAM. The biggest pieces are the caches for MyISAM or InnoDB. These caches should be tuned to use a large chunk of RAM. Other things that can be tuned rarely matter much, and the default values in my.cnf (my.ini) tend to be "good enough".

The "Query Cache" is totally distinct from the key_buffer and the buffer_pool. ALL QC entries for one table are purged when ANY change to that table occurs. Hence, if a table is being frequently modified, the QC is virtually useless. And having the QC large slows things down (except in Aurora).

Tuning memory settings


Character Sets

RoTsDiscussion

    ⚈  Use SET NAMES utf8 (or equivalent).

    ⚈  Use only ascii and utf8 (or utf8mb4 in 5.5.3+)

    ⚈  MySQL's utf8mb4 is equivalent to the outside world's UTF-8; MySQL's utf8 is only a subset.

    ⚈  Better COLLATION: utf8_unicode_520_ci > utf8_unicode_ci > utf8_general_ci > utf8_bin

    ⚈  Debug stored data via HEX(col), LENGTH(col), CHAR_LENGTH(col)

    ⚈  Do not use utf8 for hex or ascii strings (GUID, UUID, sha1, md5, ip_address, country_code, postal_code, etc.)
Too many people figure that MySQL will 'just work' when it comes to utf8. Well, it doesn't. And it is complex. And if you mess it up, it is complicated to un-mess up.

European accents take 1 byte in latin1; 2 in utf8. LENGTH(col) >= CHAR_LENGTH(col): with European text '=' for latin1, '>' for utf8.

Troubleshooting charset problems
Interpreting HEX


Datatypes - Directly supported

RoTsDiscussion

    ⚈  INT(5) is not what you think. (See SMALLINT, etc)

    ⚈  FLOAT(7,2) -- No; just say FLOAT

    ⚈  Learn the sizes: INT & FLOAT are 4 bytes, etc

    ⚈  Before using BIGINT (8 bytes), ask whether you really need such a big range.

    ⚈  Almost never use CHAR instead of VARCHAR. Use CHAR for things that are truly fixed length (and usually ascii).

    ⚈  Do not have separate DATE and TIME columns, nor separate YEAR, MONTH, etc.

    ⚈  Most INTs should be UNSIGNED.

    ⚈  Most columns should be NOT NULL.

    ⚈  TIMESTAMP's DEFAULT changed in 5.6.5.

    ⚈  VARCHAR(255) has some drawbacks over VARCHAR(11). ↣

    ⚈  Overlapping time ranges (shorter expression, but still not indexable): WHERE a.start < b.end AND a.end > b.start

    ⚈  Don't be surprised by AUTO_INCREMENT values after uncommon actions. ↣
If you have a million rows in a table, then the space difference between INT (4 bytes) and TINYINT (1 byte) is 3MB. So, if you have large tables, learn the sizes of each datatype, and pick the datatypes with an eye to minimizing the table size. Smaller → More cacheable → Less I/O → Faster.

An AUTO_INCREMENT is very non-random, at least for inserting. Each new row will be on the 'end' of the table. That is, the last block is "hot spot". Thanks to caching very little I/O is needed for an AUTO_INCREMENT index.

VARCHAR(255) for everything is tempting. And for "small" tables it won't hurt. For large tables one needs to consider what happens during the execution of complex SELECTs. VARCHAR(255) + 5.6 + Indexing + utf8mb4 = Error about a 767 limitation. See Workarounds for 767

"Burning ids": A DELETE of the last row may or many not burn that AUTO_INCREMENT id. INSERT IGNORE burns ids because it allocates values before checking for duplicate keys. A Slave may see InnoDB ids arriving out of order (because transactions arrive in COMMIT order). A ROLLBACK (explicit or implicit) will burn any ids already allocated to INSERTs. REPLACE = DELETE + INSERT, so the INSERT comments apply to REPLACE. After a crash, the next id to be assigned may or may not be what you expect; this varies with Engine and version. Etc.


Datatypes - Implicit

RoTsDiscussion

    ⚈  Money -- Do not use FLOAT/DOUBLE. DECIMAL(13,4) (6 bytes) is probably wide enough for any currency this decade.

    ⚈  GUID/UUID/MD5, as a key, will perform poorly when the table is big. ↣

    ⚈  Store GUID/UUID/MD5/SHA1 in BINARY(16/20), not VARCHAR(36/32/40) (after suitable conversion). ↣

    ⚈  IP addresses -- don't ignore IPv6, it's here now! VARBINARY(39) or BINARY(16) ↣

    ⚈  Most SEQUENCE uses can/should be converted to AUTO_INCREMENT. See also MariaDB's sequence table.

    ⚈  "Don't Queue it, just Do it" -- A database does not make a good queuing system.

    ⚈  Store images in a table? No clearcut decision.

    ⚈  Do NOT store credit card numbers, SSNs, etc, until you learn the legal ramifications of your db being hacked!

    ⚈  Latitude/Longitude -- to distinguish houses, DECIMAL(6,4)/(7,4) is sufficient. Using DOUBLE lets you distinguish hairs on a flea; do you need that? ↣

    ⚈  JSON -- If the version does not have a JSON datatype, consider using TEXT or compressing (in the client) and using BLOB. ↣
GUIDs (etc) are very random. A big table with an index on such a field will be costly to maintain. That is, the 'next' GUID to be inserted is not likely to be in an index block that is currently cached. UUID comments

Since GUID, UUID, MD5, and SHA1 are fixed length, VAR is not needed. If they are in hex, don't bother with utf8; use BINARY or CHAR CHARSET ascii.

Images could be stored in BLOB (not TEXT). This better assures referential integrity (not accidentally deleting the metadata or image, but not both). On the other hand, it is clumsy. With files, an img tag can point directly to the image on disk.

Efficient algorithm for finding "nearest" with latitude/longitude

Scaling IP range data

Using JSON for Entity-Attribute-Value


Hardware

RoTsDiscussion

    ⚈  "Count the disk hits" -- For I/O-bound queries this is the metric to use. ↣

    ⚈  A schema solution is usually better than a hardware solution for performance.

    ⚈  Plain disks can handle 100 reads/writes per second; SSDs: 1000/sec

    ⚈  RAID helps by a multiple (the number of drives)

    ⚈  RAID with BBWC (BBU): writes are "free"; set sync_binlog = 1

    ⚈  Use disk RAID striping instead of manually spreading files across drives

    ⚈  O_DIRECT or O_ALL_DIRECT (if drive directly connected)

    ⚈  Elevator: Noop or Deadline, not CFQ

    ⚈  SSD: innodb_flush_neighbors = 0; mount nobarrier

    ⚈  Filesystem: XFS or ZFS

    ⚈  Hardware cannot make up for schema/query design flaws.

    ⚈  5.6 claims to be good to 48 cores - YMMV; 5.7 claims 64.

    ⚈  A single connection will not use more than one core. Not even with UNION or PARTITION.

    ⚈  Don't put a cache in front of a cache

    ⚈  10x speed up when disk blocks are cached, so... Time a query twice -- first will get things cached, second will do no I/O. ↣

    ⚈  Benchmark with SELECT SQL_NO_CACHE ... to avoid Query cache. ↣

Because I/O is so much slower than CPUs, the first few queries on a 'cold' system take longer. This can be demonstrated by running a SELECT twice. (Be sure to avoid the Query cache.) The first run will fetch data from disk; the second will find everything cached -- roughly 10x faster.

"Count the disk hits": For large databases, the I/O dominates the time consumed -- often by a factor of 10. So, focus on how to minimize I/O, "cluster" data, create indexes that are more effective, etc.

Tentative ZFS settings: zfs_prefetch_disable=1, primarycache=metadata (because O_DIRECT is not available on ZFS), recordsize=16K, logbias=throughput, innodb_checksum=0 or innodb_checksum_algorithm=none (ZFS does the checksumming already), innodb_doublewrite=0


PXC / Galera

RoTsDiscussion

    ⚈  InnoDB only; always have a PRIMARY KEY

    ⚈  Check for errors, even after COMMIT

    ⚈  For optimal performance, use 'medium-sized' transactions

    ⚈  Cross-colo replication may be faster or slower than traditional replication

    ⚈  AUTO_INCREMENT values won't be consecutive

    ⚈  Handle "critical reads" using wsrep_causal_reads

    ⚈  ALTERs need to be handled differently (see RSU vs TOI)

    ⚈  Lots of tricks are based on: remove a node from cluster + do stuff + add back to cluster

    ⚈  Minimal HA: 1 node in each of 3 datacenters; one could be just a grabd
Most of these RoTs apply to Group Replication / InnoDB Cluster, though the terminology may be different.

A few things need to be done differently when using Galera-based systems, such as Percona XtraDB Cluster.

Since there is one inter-node action per transaction, medium-sized transactions are a good tradeoff between inter-node delays and prompt replication.

Trust nodes to heal themselves (via SST or IST); this leads to significantly lowered manual intervention for dead nodes, etc.

Critical Reads are no longer a problem, except for the minor code change.

More discussion


Data Warehouse

RoTsDiscussion

    ⚈  Create Summary Table(s) ("materialized views") ↣

    ⚈  Normalize, but don't over-normalize.

    ⚈  The average of averages is (usually) mathematically incorrect. ↣

    ⚈  InfoBright (3rd party) -- 10:1 compression; all columns automatically indexed

    ⚈  TokuDB (3rd party) -- 3:1 compression; faster loading ("fractal" technology)

    ⚈  PARTITION BY RANGE the Fact table on a unit of time (to make DELETE of old data efficient).

    ⚈  Use the smallest practical datatype for each field (to shrink the 'fact' table).

    ⚈  Use InnoDB. That way, recovery from a power failure will be fast and painless.

    ⚈  Don't have any indexes other than an AUTO_INCREMENT PRIMARY KEY for the fact table. That way, INSERTs into it will be fast. Periodic augmentation of the summary table(s) can use that to keep track of where they "left off".

    ⚈  "Sharding" (splitting data across multiple machines) is mostly do-it-yourself. Or... Clustrix, Spider

    ⚈  Look into 3rd party solutions such as ColumnStore or TokuDB in MariaDB
Data Warehousing usually has "reports". These tend to be COUNTs, SUMs, AVERAGEs, etc, of large amounts of data, broken down by hours/days/weeks, together with some other "dimensions" like department, country, product, etc.

Doing such reports against the raw ("Fact") table is costly because of the I/O to read lots of that table. Creating and maintaining "Summary table" is a technique for generating reports much more efficiently (typically 10x-100x faster).

A Summary table has usually has, say, PRIMARY KEY(product, day), plus other columns that are COUNTs, SUMs, etc, of metrics for the given product+day. A report reads the Summary table, not the Fact table, and it finishes any further arithmetic. A Summary table based on days can be used to genearte a weekly report by suitable SUMs and GROUP BY. AVERAGEs should be done by SUM(sum)/SUM(count).

Data Warehouse
Summary Tables


Miscellany

RoTsDiscussion

    ⚈  MySQL can run 1000 qps. (just a RoT; YMMV) ↣

    ⚈  The SlowLog is the main clue into performance problems. Keep it on. Use long_query_time=2.

    ⚈  Leave log_queries_not_using_indexes off -- it clutters the slowlog

    ⚈  1000+ Databases or tables is a clue of poor schema design

    ⚈  10,000+ Databases or tables will run very slowly because of OS overhead

    ⚈  < 10% improvement -- don't bother. Exception: shrink the datatypes before deploying

    ⚈  Do not normalize "continuous" values -- dates, floats, etc -- especially if you will do range queries.

    ⚈  Beware of SQL injection. ↣

    ⚈  If you can't finish an InnoDB transaction in 5 seconds, redesign it.

    ⚈  MySQL has many builtin 'hard' limits; you will not hit any of them. ↣

    ⚈  An excessive MaxClients (Apache) can cause trouble with max_connections

    ⚈  Connection pooling is generally not worth the effort. (Not to be confused with 5.7's Thread Pooling.)

    ⚈  Use Row Based Replication (RBR)

    ⚈  A Slave can have only one Master. (Exceptions: 5.7, MariaDB, ~Galera)

    ⚈  If you need to do multiple ALTERs, study the documentation for your version. Some cases run faster by doing all in a single ALTER; some run faster separately with INPLACE. ↣

    ⚈  "Load average" often raises false alarms.

    ⚈  Pick carefully between REPLACE (== DELETE + INSERT), INSERT IGNORE, and INSERT ... ON DUPLICATE KEY UPDATE (aka "IODKU").

    ⚈  When Threads_running > 10, you may be in serious trouble.

    ⚈  SHOW PROCESSLIST with some threads "Locked" -- some other thread is hogging something.

    ⚈  SHOW PROCESSLIST may fail to show the locking thread -- it is Sleeping, but not yet COMMITted; possibly misuse of autocommit

    ⚈  >90% CPU --> investigate queries/indexes. (The SlowLog also catches such.)

    ⚈  >90% of one core -- since MySQL won't use multiple cores in a single connection, this indicates an inefficient query. (Eg, 12% overall on an 8-core box is probably consuming one core.)

    ⚈  >90% I/O -- tuning, overall schema design, missing index, etc.

    ⚈  "NoSQL" is a catchy phrase looking for a definition. By the time NoSQL gets a definition, it will look a lot like an RDBMS solution.
MySQL can run thousands of trivial queries on modern hardware. Some special benchmarks have driven InnoDB past 100K qps. At the other extreme, I have seen a query run for a month. 1000 qps is simply a RoT that applies to a lot of systems; but your mileage can really vary a lot.

Normalizing dates runs afoul of the 20% RoT, plus making it impossible to do range scans. Over-normalization can lead to inefficiencies. Why have a 4-byte INT as an id for the 200 countries in the world; simply use a 2-byte country_code CHAR(2) CHARSET ascii.

SQL Injection is where you take user input (say, from an HTML form) and insert it verbatim into a SQL statement. Some hacker will soon find that your site is not protecting itself and have his way with your data.

ALTER, in some situations, completely copies over the table and rebuilds all the indexes. For a huge table, the can take days. Doing two ALTERs means twice the work; A single ALTER statement with several operations in it. OPTIMIZE is similarly costly, and may not provide much benefit. 5.7 'INPLACE'

MySQL 5.7's JSON and MariaDB 5.3's "Dynamic Columns" eats into a big excuse for "NoSQL".

MySQL's 'hard' limits

Tumblr Architecture - 15 Billion Page Views a Month and Harder to Scale than Twitter


Tumblr Architecture - 15 Billion Page Views a Month and Harder to Scale than Twitter


With over 15 billion page views a month Tumblr has become an insanely popular blogging platform. Users may like Tumblr for its simplicity, its beauty, its strong focus on user experience, or its friendly and engaged community, but like it they do.

Growing at over 30% a month has not been without challenges. Some reliability problems among them. It helps to realize that Tumblr operates at surprisingly huge scales: 500 million page views a day, a peak rate of ~40k requests per second, ~3TB of new data to store a day, all running on 1000+ servers.

One of the common patterns across successful startups is the perilous chasm crossing from startup to wildly successful startup. Finding people, evolving infrastructures, servicing old infrastructures, while handling huge month over month increases in traffic, all with only four engineers, means you have to make difficult choices about what to work on. This was Tumblr’s situation. Now with twenty engineers there’s enough energy to work on issues and develop some very interesting solutions.

Tumblr started as a fairly typical large LAMP application. The direction they are moving in now is towards a distributed services model built around Scala, HBase, Redis, Kafka, Finagle,  and an intriguing cell based architecture for powering their Dashboard. Effort is now going into fixing short term problems in their PHP application, pulling things out, and doing it right using services.

The theme at Tumblr is transition at massive scale. Transition from a LAMP stack to a somewhat bleeding edge stack. Transition from a small startup team to a fully armed and ready development team churning out new features and infrastructure. To help us understand how Tumblr is living this theme is startup veteran Blake Matheny, Distributed Systems Engineer at Tumblr. Here’s what Blake has to say about the House of Tumblr:

Site:  http://www.tumblr.com/

Stats

  • 500 million page views a day
  • 15B+ page views month
  • ~20 engineers
  • Peak rate of ~40k requests per second
  • 1+ TB/day into Hadoop cluster
  • Many TB/day into MySQL/HBase/Redis/Memcache
  • Growing at 30% a month
  • ~1000 hardware nodes in production
  • Billions of page visits per month per engineer
  • Posts are about 50GB a day. Follower list updates are about 2.7TB a day.
  • Dashboard runs at a million writes a second, 50K reads a second, and it is growing.

Software

  • OS X for development, Linux (CentOS, Scientific) in production
  • Apache
  • PHP, Scala, Ruby
  • Redis, HBase, MySQL
  • Varnish, HA-Proxy, nginx,
  • Memcache, Gearman, Kafka, Kestrel, Finagle
  • Thrift, HTTP
  • Func - a secure, scriptable remote control framework and API
  • Git, Capistrano, Puppet, Jenkins

Hardware

  • 500 web servers
  • 200 database servers (many of these are part of a spare pool we pulled from for failures)
    • 47 pools
    • 30 shards
  • 30 memcache servers
  • 22 redis servers
  • 15 varnish servers
  • 25 haproxy nodes
  • 8 nginx
  • 14 job queue servers (kestrel + gearman)

Architecture

  • Tumblr has a different usage pattern than other social networks.
    • With 50+ million posts a day, an average post goes to many hundreds of people. It’s not just one or two users that have millions of followers. The graph for Tumblr users has hundreds of followers. This is different than any other social network and is what makes Tumblr so challenging to scale.
    • #2 social network in terms of time spent by users. The content is engaging. It’s images and videos. The posts aren’t byte sized. They aren’t all long form, but they have the ability. People write in-depth content that’s worth reading so people stay for hours.
    • Users form a connection with other users so they will go hundreds of pages back into the dashboard to read content. Other social networks are just a stream that you sample.
    • Implication is that given the number of users, the average reach of the users, and the high posting activity of the users, there is a huge amount of updates to handle.
  • Tumblr runs in one colocation site. Designs are keeping geographical distribution in mind for the future.
  • Two components to Tumblr as a platform: public Tumblelogs and Dashboard
    • Public Tumblelog is what the public deals with in terms of a blog. Easy to cache as its not that dynamic.
    • Dashboard is similar to the Twitter timeline. Users follow real-time updates from all the users they follow.
      • Very different scaling characteristics than the blogs. Caching isn’t as useful because every request is different, especially with active followers.
      • Needs to be real-time and consistent. Should not show stale data. And it’s a lot of data to deal with. Posts are only about 50GB a day. Follower list updates are 2.7TB a day. Media is all stored on S3.
    • Most users leverage Tumblr as tool for consuming of content. Of the 500+ million page views a day, 70% of that is for the Dashboard.
    • Dashboard availability has been quite good. Tumblelog hasn’t been as good because they have a legacy infrastructure that has been hard to migrate away from. With a small team they had to pick and choose what they addressed for scaling issues.

Old Tumblr

  • When the company started on Rackspace it gave each custom domain blog an A record. When they outgrew Rackspace there were too many users to migrate. This is 2007. They still have custom domains on Rackspace. They route through Rackspace back to their colo space using HAProxy and Varnish. Lots of legacy issues like this.
  • A traditional LAMP progression.
    • Historically developed with PHP. Nearly every engineer programs in PHP.
    • Started with a web server, database server and a PHP application and started growing from there.
    • To scale they started using memcache, then put in front-end caching, then HAProxy in front of the caches, then MySQL sharding. MySQL sharding has been hugely helpful.
    • Use a squeeze everything out of a single server approach. In the past year they’ve developed a couple of backend services in C: an ID generator and Staircar, using Redis to power Dashboard notifications
  • The Dashboard uses a scatter-gather approach. Events are displayed when a user access their Dashboard. Events for the users you follow are pulled and displayed. This will scale for another 6 months. Since the data is time ordered sharding schemes don’t work particularly well.

New Tumblr

  • Changed to a JVM centric approach for hiring and speed of development reasons.
  • Goal is to move everything out of the PHP app into services and make the app a thin layer over services that does request authentication, presentation, etc.
  • Scala and Finagle Selection
    • Internally they had a lot of people with Ruby and PHP experience, so Scala was appealing.
    • Finagle was a compelling factor in choosing Scala. It is a library from Twitter. It handles most of the distributed issues like distributed tracing, service discovery, and service registration. You don’t have to implement all this stuff. It just comes for free.
    • Once on the JVM Finagle provided all the primitives they needed (Thrift, ZooKeeper, etc).
    • Finagle is being used by Foursquare and Twitter. Scala is also being used by Meetup.
    • Like the Thrift application interface. It has really good performance.
    • Liked Netty, but wanted out of Java, so Scala was a good choice.
    • Picked Finagle because it was cool, knew some of the guys, it worked without a lot of networking code and did all the work needed in a distributed system.
    • Node.js wasn’t selected because it is easier to scale the team with a JVM base. Node.js isn’t developed enough to have standards and best practices, a large volume of well tested code. With Scala you can use all the Java code. There’s not a lot of knowledge of how to use it in a scalable way and they target 5ms response times, 4 9s HA, 40K requests per second and some at 400K requests per second. There’s a lot in the Java ecosystem they can leverage.
  • Internal services are being shifted from being C/libevent based to being Scala/Finagle based.
  • Newer, non-relational data stores like HBase and Redis are being used, but the bulk of their data is currently stored in a heavily partitioned MySQL architecture. Not replacing MySQL with HBase.
  • HBase backs their URL shortner with billions of URLs and all the historical data and analytics. It has been rock solid. HBase is used in situations with high write requirements, like a million writes a second for the Dashboard replacement.  HBase wasn’t deployed instead of MySQL because they couldn’t bet the business on HBase with the people that they had, so they started using it with smaller less critical path projects to gain experience.
  • Problem with MySQL and sharding for time series data is one shard is always really hot. Also ran into read replication lag due to insert concurrency on the slaves.
  • Created a common services framework.
    • Spent a lot of time upfront solving operations problem of how to manage a distributed system.
    • Built a kind of Rails scaffolding, but for services. A template is used to bootstrap services internally.
    • All services look identical from an operations perspective. Checking statistics, monitoring, starting and stopping all work the same way for all services.
    • Tooling is put around the build process in SBT (a Scala build tool) using plugins and helpers to take care of common activities like tagging things in git, publishing to the repository, etc. Most developers don’t have to get in the guts of the build system.
  • Front-end layer uses HAProxy. Varnish might be hit for public blogs. 40 machines.
  • 500 web servers running Apache and their PHP application.
  • 200 database servers. Many database servers are used for high availability reasons. Commodity hardware is used an the MTBF is surprisingly low. Much more hardware than expected is lost so  there are many spares in case of failure.
  • 6 backend services to support the PHP application. A team is dedicated to develop the backend services. A new service is rolled out every 2-3 weeks. Includes dashboard notifications, dashboard secondary index, URL shortener, and a memcache proxy to handle transparent sharding.
  • Put a lot of time and effort and tooling into MySQL sharding. MongoDB is not used even though it is popular in NY (their location). MySQL can scale just fine..
  • Gearman, a job queue system, is used for long running fire and forget type work.
  • Availability is measured in terms of reach. Can a user reach custom domains or the dashboard? Also in terms of error rate.
  • Historically the highest priority item is fixed. Now failure modes are analyzed and addressed systematically. Intention is to measure success from a user perspective and an application perspective. If part of a request can’t be fulfilled that is account for
  • Initially an Actor model was used with Finagle, but that was dropped.  For fire and forget work a job queue is used. In addition, Twitter’s utility library contains a Futures implementation and services are implemented in terms of futures. In the situations when a thread pool is needed futures are passed into a future pool. Everything is submitted to the future pool for asynchronous execution.
  • Scala encourages no shared state. Finagle is assumed correct because it’s tested by Twitter in production. Mutable state is avoided using constructs in Scala or Finagle. No long running state machines are used. State is pulled from the database, used, and writte n back to the database. Advantage is developers don’t need to worry about threads or locks.
  • 22 Redis servers. Each server has 8 - 32 instances so 100s of Redis instances are used in production.
    • Used for backend storage for dashboard notifications.
    • A notification is something  like a user liked your post. Notifications show up in a user’s dashboard to indicate actions other users have taken on their content.
    • High write ratio made MySQL a poor fit.  
    • Notifications are ephemeral so it wouldn’t be horrible if they were dropped, so Redis was an acceptable choice for this function.
    • Gave them a chance to learn about Redis and get familiar with how it works.
    • Redis has been completely problem free and the community is great.
    • A Scala futures based interface for Redis was created. This functionality is now moving into their Cell Architecture.
    • URL shortener uses Redis as the first level cache and HBase as permanent storage.
    • Dashboard’s secondary index is built around Redis.
    • Redis is used as Gearman’s persistence layer using a memcache proxy built using Finagle.
    • Slowly moving from memcache to Redis. Would like to eventually settle on just one caching service. Performance is on par with memcache.

Internal Firehose

  • Internally applications need access to the activity stream. An activity steam is information about users creating/deleting posts, liking/unliking posts, etc.  A challenge is to distribute so much data in real-time. Wanted something that would scale internally and that an application ecosystem could reliably grow around. A central point of distribution was needed.
  • Previously this information was distributed using Scribe/Hadoop. Services would log into Scribe and begin tailing and then pipe that data into an app. This model stopped scaling almost immediately, especially at peak where people are creating 1000s of posts a second. Didn’t want people tailing files and piping to grep.
  • An internal firehose was created as a message bus. Services and applications talk to the firehose via Thrift.
  • LinkedIn’s Kafka is used to store messages. Internally consumers use an HTTP stream to read from the firehose. MySQL wasn’t used because the sharding implementation is changing frequently so hitting it with a huge data stream is not a good idea.
  • The firehose model is very flexible, not like Twitter’s firehose in which data is assumed to be lost.
    • The firehose stream can be rewound in time. It retains a week of data. On connection it’s possible to specify the point in time to start reading.
    • Multiple clients can connect and each client won’t see duplicate data. Each client has a client ID. Kafka supports a consumer group idea. Each consumer in a consumer group gets its own messages and won’t see duplicates. Multiple clients can be created using the same consumer ID and clients won’t see duplicate data. This allows data to be processed independently and in parallel. Kafka uses ZooKeeper to periodically checkpoint how far a consumer has read.

Cell Design for Dashboard Inbox

  • The current scatter-gather model for providing Dashboard functionality has very limited runway. It won’t last much longer.
    • The solution is to move to an inbox model implemented using a Cell Based Architecture that is similar to Facebook Messages.
    • An inbox is the opposite of scatter-gather. A user’s dashboard, which is made up posts from followed users and actions taken by other users,  is logically stored together in time order.
    • Solves the scatter gather problem because it’s an inbox. You just ask what is in the inbox so it’s less expensive then going to each user a user follows. This will scale for a very long time.
  • Rewriting the Dashboard is difficult. The data has a distributed nature, but it has a transactional quality, it’s not OK for users to get partial updates.
    • The amount of data is incredible. Messages must be delivered to hundreds of different users on average which is a very different problem than Facebook faces. Large date + high distribution rate + multiple datacenters.
    • Spec’ed at a million writes a second and 50K reads a second. The data set size is 2.7TB of data growth with no replication or compression turned on. The million writes a second is from the 24 byte row key that indicates what content is in the inbox.
    • Doing this on an already popular application that has to be kept running.
  • Cells
    • A cell is a self-contained installation that has all the data for a range of users. All the data necessary to render a user’s Dashboard is in the cell.
    • Users are mapped into cells. Many cells exist per data center.
    • Each cell has an HBase cluster, service cluster, and Redis caching cluster.
    • Users are homed to a cell and all cells consume all posts via firehose updates.
    • Each cell is Finagle based and populates HBase via the firehose and service requests over Thrift.
    • A user comes into the Dashboard, users home to a particular cell, a service node reads their dashboard via HBase, and passes the data back.
    • Background tasks consume from the firehose to populate tables and process requests.
    • A Redis caching layer is used for posts inside a cell.
  • Request flow: a user publishes a post, the post is written to the firehose, all of the cells consume the posts and write that post content to post database, the cells lookup to see if any of the followers of the post creator are in the cell, if so the follower inboxes are updated with the post ID.
  • Advantages of cell design:
    • Massive scale requires parallelization and parallelization requires components be isolated from each other so there is no interaction. Cells provide a unit of parallelization that can be adjusted to any size as the user base grows.
    • Cells isolate failures. One cell failure does not impact other cells.
    • Cells enable nice things like the ability to test upgrades, implement rolling upgrades, and test different versions of software.
  • The key idea that is easy to miss is:  all posts are replicated to all cells.
    • Each cell stores a single copy of all posts. Each cell can completely satisfy a Dashboard rendering request. Applications don’t ask for all the post IDs and then ask for the posts for those IDs. It can return the dashboard content for the user. Every cell has all the data needed to fulfill a Dashboard request without doing any cross cell communication.
    • Two HBase tables are used: one that stores a copy of each post. That data is small compared to the other table which stores every post ID for every user within that cell. The second table tells what the user’s dashboard looks like which means they don’t have to go fetch all the users a user is following. It also means across clients they’ll know if you read a post and viewing a post on a different device won’t mean you read the same content twice. With the inbox model state can be kept on what you’ve read.
    • Posts are not put directly in the inbox because the size is too great. So the ID is put in the inbox and the post content is put in the cell just once. This model greatly reduces the storage needed while making it simple to return a time ordered view of an users inbox. The downside is each cell contains a complete copy of call posts. Surprisingly posts are smaller than the inbox mappings. Post growth per day is 50GB per cell, inbox grows at 2.7TB a day. Users consume more than they produce.
    • A user’s dashboard doesn’t contain the text of a post, just post IDs, and the majority of the growth is in the IDs.
    • As followers change the design is safe because all posts are already in the cell. If only follower posts were stored in a cell then cell would be out of date as the followers changed and some sort of back fill process would be needed.
    • An alternative design is to use a separate post cluster to store post text. The downside of this design is that if the cluster goes down it impacts the entire site.  Using the cell design and post replication to all cells creates a very robust architecture.
  • A user having millions of followers who are really active is handled by selectively materializing user feeds by their access model (see Feeding Frenzy).
    • Different users have different access models and distribution models that are appropriate. Two different distribution modes: one for popular users and one for everyone else.
    • Data is handled differently depending on the user type. Posts from active users wouldn’t actually be published, posts would selectively materialized.
    • Users who follow millions of users are treated similarly to users who have millions of followers.
  • Cell size is hard to determine. The size of cell is the impact site of a failure. The number of users homed to a cell is the impact. There’s a tradeoff to make in what they are willing to accept for the user experience and how much it will cost.
  • Reading from the firehose is the biggest network issue. Within a cell the network traffic is manageable.
  • As more cells are added cells can be placed into a cell group that reads from the firehose and then replicates to all cells within the group. A hierarchical replication scheme. This will also aid in moving to multiple datacenters.

On Being a Startup in New York

  • NY is a different environment. Lots of finance and advertising. Hiring is challenging because there’s not as much startup experience.
  • In the last few years NY has focused on helping startups. NYU and Columbia have programs for getting students interesting internships at startups instead of just going to Wall Street. Mayor Bloomberg is establishing a local campus focused on technology.

Team Structure

  • Teams: infrastructure, platform, SRE, product, web ops, services.
  • Infrastructure: Layer 5 and below. IP address and below, DNS, hardware provisioning.
  • Platform: core app development, SQL sharding, services, web operations.
  • SRE: sits between service team and web ops team. Focused on more immediate needs in terms of reliability and scalability.
  • Service team: focuses on things that are slightly more strategic, that are a month or two months out.
  • Web ops: responsible for problem detection and response, and tuning.

Software Deployment

  • Started with a set of rsync scripts that distributed the PHP application everywhere. Once the number of machines reached 200 the system started having problems, deploys took a long time to finish and machines would be in various states of the deploy process.
  • The next phase built the deploy process (development, staging, production) into their service stack using Capistrano. Worked for services on dozens of machines, but by connecting via SSH it started failing again when deploying to hundreds of machines.
  • Now a piece of coordination software runs on all machines. Based around Func from RedHat, a lightweight API for issuing commands to hosts. Scaling is built into Func.
  • Build deployment is over Func by saying do X on a set of hosts, which avoids SSH. Say you want to deploy software on group A. The master reaches out to a set of nodes and runs the deploy command.
  • The deploy command is implemented via Capistrano. It can do a git checkout or pull from the repository. Easy to scale because they are talking HTTP. They like Capistrano because it supports simple directory based versioning that works well with their PHP app. Moving towards versioned updates, where each directory contains a SHA so it’s easy to check if a version is correct.
  • The Func API is used to report back status, to say these machines have these software versions.
  • Safe to restart any of their services because they’ll drain off connections and then restart.
  • All features run in dark mode before activation.

Development

  • Started with the philosophy that anyone could use any tool that they wanted, but as the team grew that didn’t work. Onboarding new employees was very difficult, so they’ve standardized on a stack so they can get good with those, grow the team quickly, address production issues more quickly, and build up operations around them.
  • Process is roughly Scrum like. Lightweight.  
  • Every developer has a preconfigured development machine. It gets updates via Puppet.
  • Dev machines can roll changes, test, then roll out to staging, and then roll out to production.
  • Developers use vim and Textmate.
  • Testing is via code reviews for the PHP application.
  • On the service side they’ve implemented a testing infrastructure with commit hooks, Jenkins, and continuous integration and build notifications. 

Hiring Process

  • Interviews usually avoid math, puzzles, and brain teasers. Try to ask questions focused on work the candidate will actually do. Are they smart? Will they get stuff done? But measuring “gets things done” is difficult to assess. Goal is to find great people rather than keep people out.
  • Focused on coding. They’ll ask for sample code. During phone interviews they will use Collabedit to write shared code.
  • Interviews are not confrontational, they just want to find the best people. Candidates get to use all their tools, like Google, during the interview. The idea is developers are at their best when they have tools so that’s how they run the interviews.
  • Challenge is finding people that have the scaling experience they require given Tumblr’s traffic levels. Few companies in the world are working on the problems they are.
    • Example, for a new ID generator they needed A JVM process to generate service responses in less the 1ms at a rate at 10K requests per second with a 500 MB RAM limit with High Availability. They found the serial collector gave the lowest latency for this particular work load. Spent a lot of time on JVM tuning.
  • On the Tumblr Engineering Blog they’ve posted memorials giving their respects for the passing of Dennis Ritchie & John McCarthy. It’s a geeky culture.

Lessons learned

  • Automation everywhere.
  • MySQL (plus sharding) scales, apps don't.
  • Redis is amazing.
  • Scala apps perform fantastically.
  • Scrap projects when you aren’t sure if they will work.
  • Don’t hire people based on their survival through a useless technological gauntlet.  Hire them because they fit your team and can do the job.
  • Select a stack that will help you hire the people you need.
  • Build around the skills of your team.
  • Read papers and blog posts. Key design ideas like the cell architecture and selective materialization were taken from elsewhere.
  • Ask your peers. They talked to engineers from Facebook, Twitter, LinkedIn about their experiences and learned from them. You may not have access to this level, but reach out to somebody somewhere.
  • Wade, don’t jump into technologies. They took pains to learn HBase and Redis before putting them into production by using them in pilot projects or in roles where the damage would be limited.

I’d like to thank Blake very much for the interview. He was very generous with his time and patient with his explanations. Please contact me if you would like to talk about having your architecture profiled.

Related Articles

MySQL Performance: Scalability on OLTP_RW Benchmark with MySQL 5.7

MySQL Performance: Scalability on OLTP_RW Benchmark with MySQL 5.7

Next article from the MySQL 5.7 Performance stories, now about OLTP_RW scalability (if you missed any previous ones, see 1.6M SQL Query/sec (QPS) with MySQL 5.7, 1M SQL Query/sec on mixed OLTP_RO / true Point-Selects performance / over 100K Connect/sec Rate / Re:Visiting nnoDB vs MyISAM Performance -- all with MySQL 5.7)..

Before we'll start looking on OLTP_RW results, let me explain first why we payed so many attention to MySQL 5.7 Performance in RO (read-only) workloads (and all my previous posts were mostly about RO as well).. -- the reason is very simple: there is no great RW performance if RO is lagging.. And also because we were pretty bad on RO before 5.7 ;-))

Let's get a look on the following graphs :
  • the graphs are representing the test results obtained more than 2 years ago..
  • they are all obtained from the same 32cores-HT server (4CPU sockets, each with 8cores-HT)
  • and we were looking for the best possible MySQL server performance on this host by limiting MySQL instance to be running on 1/2/4CPUs (8/16/32cores) and using/not-using CPU HyperThreading (HT) (16cores-HT vs 16cores, etc.)..

So, what we observed over 2 years when MySQL 5.7 development was just started ?..

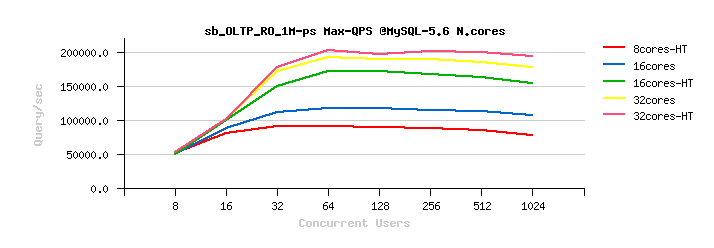
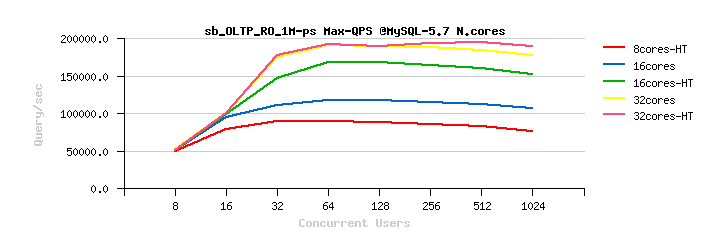
Here are the results obtained on OLTP_RO workload on MySQL 5.5 / 5.6 / and 5.7 on that time :
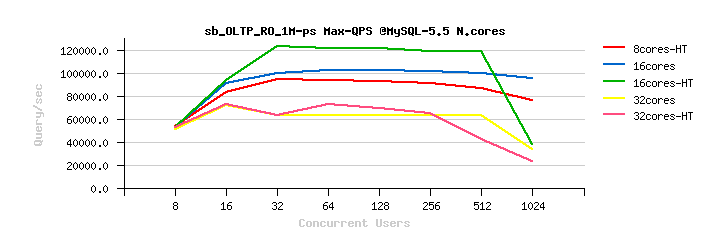


Observations :
  • on MySQL 5.5 :
    • the results on 16cores-HT are x2 times better than on 32cores..
  • on MySQL 5.6 :
    • the results on 32cores are just slightly better than on 16cores-HT
    • as well the difference between 32cores vs 32cores-HT results is pretty small..
  • on MySQL 5.7 :
    • same as on 5.6, the results on 32cores are just slightly better than on 16cores-HT
    • but near no difference at all in 32cores vs 32cores-HT results..
    • and, the most painful, is that an overall result is worse than on MySQL 5.6 (!)..
  • this was the first painful point from where MySQL 5.7 was started over 2 years ago ;-))
  • (and probably you're better understanding now why we're so happy to see MySQL 5.7 scaling really well today and easily reaching now over 1M QPS on the same OLTP_RO workload ;-))

But well, let's go back 2 years ago again, and see also what it was about OLTP_RW workload on that time :

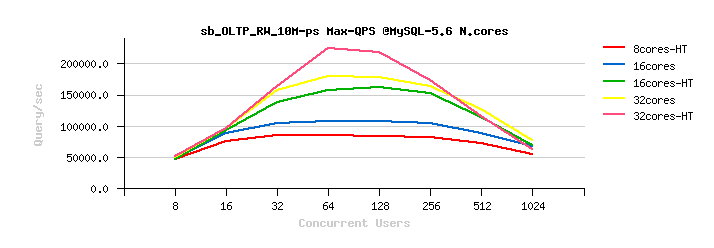
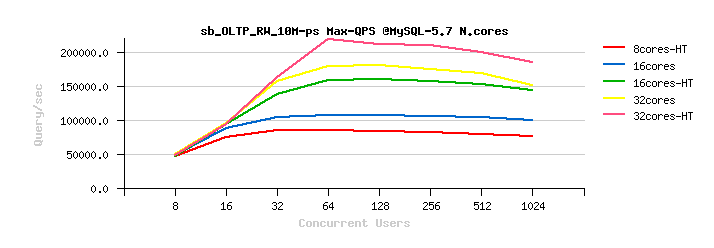
The following are the similar test results on MySQL 5.5/ 5.6/ 5.7 , but about OLTP_RW :
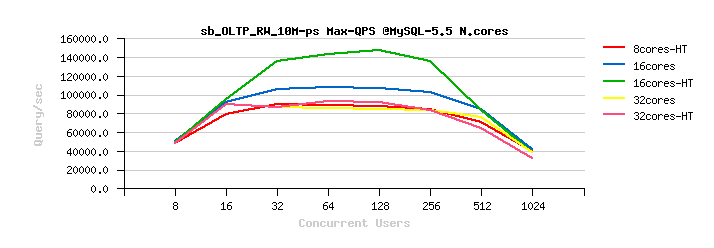


Observations :
  • I think you may observe the same tendency by yourself :
    • MySQL 5.5 is scaling up to only 16cores-HT
    • on MySQL 5.6 and 5.7 the results on 32cores are better than on 16cores
    • the benefit from CPU HyperThreading is better seen on 32cores-HT now (but not that big as on 16cores-HT)
    • however, MySQL 5.7 is better "resisting" to a higher concurrent users load
    • while the Max peak TPS is still reached by MySQL 5.6, and not 5.7 ;-))
  • but the most killing here is not this..
  • in fact the presented OLTP_RW results are intentionally presented in QPS (Query/sec) and not in TPS (Transactions/sec)
  • this is making OLTP_RW results "comparable" with OLTP_RO ;-))
  • from where you may discover the painful point #2 :
    • over 2 years ago our OLTP_RW performance was better than OLTP_RO (!!!)
    • and this was true for all presented MySQL versions on that time..
    • NOTE : OLTP_RW workload is including OLTP_RO ;-))
    • NOTE (again) : to be exact, OLTP_RW is extending OLTP_RO by adding write operations (INSERT, DELETE, UPDATE), so we're writing to the disk, we're logging every transaction, we're hitting transaction/REDO locking, and we're still reaching a higher QPS level than a pure OLTP_RO running fully in-memory... -- and this is all because our transactions management in InnoDB on that time was very heavy on locks and did not scale at all..
  • Hope you can better understand now our frustration level 2 years ago, and challenges we faced on that time ;-))

That's why so many efforts were spent to improve InnoDB performance in MySQL 5.7 on RO workloads.. -- was this challenge fully completed?.. -- not yet (some specific cases (block lock, AHI, etc.) are still remaining; then many new functionality features were added in MySQL 5.7 over a time, and adding more code making an overall code path more long as well, so on low load RO workloads you may observe some slight regressions with MySQL 5.7 today.. -- however, as soon as your load is growing, you'll see a real benefit from improved MySQL 5.7 scalability ;-)) Le's say that with MySQL we got a rid of the "main scalability show-stopper" for RO workloads! - and, of course, we don't stop here, work in progress, and yet more other improvements are in our TODO list ;-))

Now, what about MySQL 5.7 Performance on RW workloads ?..
  • the main InnoDB RW scalability show-stopper (generally and particularly in MySQL 5.7) is REDO log locking (log_sys mutex)
  • well, to be exact, log_sys contention is the "final" show-stopper ;-))
  • while before hitting log_sys, you may hit and be blocked by :
    • index lock contention (big stopper for RW workloads, was finally fixed since MySQL 5.7 only.. -- before the only possible "workaround" was to use partitioning (this will split your hot table in several tables (partitions), means split your index as well, means split your contention by the number of partitions, etc)..
    • transaction lock (trx_sys mutex) -- greatly improved in MySQL 5.7 too
    • lock_sys overhead -- lowered in MySQL 5.7, but need yet to be more improved..
    • AHI (Adaptive Hash Index) contention (btr_search_latch RW-lock) -- there is a huge story behind it, but to make it short - you're better to disable it on RW workloads, as every data modification is involving AHI update (e.g. write lock), and you're quickly hitting a serialization here.. (work in progress to improve it)..
  • but well, as soon as you're using MySQL 5.7, your main RW "scalability limit" will be mostly log_sys contention ;-))
  • and, unfortunately, we were not able on MySQL 5.7 timeframe to improve this part of code as much as we made it for RO issues..
  • a true fix is requiring a complete REDO log management re-design, and our timing was not favorable here..
  • however, a probe prototype of the potential new solution showed us a great improvement (you can see its impact in the past LinkBench test results on MySQL 5.7)..
  • the amazing part of this probe patch was that we were able to reach the same or better performance while using innodb_flush_log_at_trx_commit=1 (and flushing REDO log on every transaction) vs innodb_flush_log_at_trx_commit=2 (flushing REDO log only once per second).. -- this clearly proved that the main issue here is not the IO related fsync() of REDO log file, but the REDO log management itself..
  • but well, we're not yet there ;-))
  • so, while our MySQL 5.7 scalability on RW workloads got more better with innodb_flush_log_at_trx_commit=2, we're not really better with innodb_flush_log_at_trx_commit=1 yet (and on low loads / small HW configs you may see no difference vs MySQL 5.6) -- in fact getting other contentions lowered, the log_sys contention became more hot, and there is nothing to do with it, except to get it fixed, so the work in progress is here too ;-)) -- while with MySQL 5.6 you may still hit instead many other problems which were fixed only since MySQL 5.7, so the best answer here will be only your own test validation..

Well, this was about internal contentions which may limit RW scalability. While there are still few more factors :

  • trx_commit (trx) -- already mentioning before (innodb_flush_log_at_trx_commit=0/2/1) and, of course, flushing REDO log data to disk on every transaction commit (innodb_flush_log_at_trx_commit=1) for sure will bring more penalty if you're flushing REDO only once per second (innodb_flush_log_at_trx_commit=2) -- while the risk here is to loose the last second transaction(s) only (and maybe even nothing if your OS & storage did not crash or if you're using semi-sync replication, or even less than last 1 sec (because in reality REDO log with innodb_flush_log_at_trx_commit=2 is still flushed more often than once per second), and even many "serious companies" are doing so, etc.etc.) -- but well, you're always better to evaluate what is valid for your own production ;-))

  • flush_method -- as you're writing to disk, you have to choose the way how your page writes will be flushed to the disk.. -- InnoDB has several options here (and you may find many discussions around and different people defending different option preferences, etc.) -- I'd say from all the past experience and fighting various issues with FS cache, my preferred option here will be to use O_DIRECT (or O_DIRECT_NOFSYNC when available) combined with AIO (innodb_flush_method=O_DIRECT_NOFSYNC and innodb_use_native_aio=1). And, curiously, I'm still prefer EXT4 (while many are claiming XFS is better) -- will post my observations later about ;-))

  • double_write (dblwr) -- the only solution InnoDB has to protect your data from partially written pages on system crash (so, InnoDB will write each page twice: first on dblwr buffer disk space (sys tablespace), and once the write is confirmed, the page is written on its own place (and if on that write the system will crash, the valid page copy will be recovered from dblwr)) -- while I often hear that on the "modern HW" not need to care about, the risk is still here ;-)) and it's still up to you to decide will you turn this protection ON or OFF (innodb_doublewrite=1/0). However, there are several alternatives are possible:
    • you may buy Fusion-io flash card and use their NVMFS filesystem which is supporting "atomic IO writes" (so each page write is confirmed to be fully written) -- MySQL 5.7 is supporting this card automatically (combined with O_DIRECT)
    • you may use "secured" by-design FS (like ZFS for ex. or ZFS Appliance) -- such a storage solution by definition will garantee you'll never loose any bit of your data ;-)) (on the same time don't be surprised your writes are going slower -- each write (and read!) is hardly verified) -- while this may still be faster than the current dblwr..
    • or use FS with data journal (like EXT4, but you have to use O_DSYNC with it, so some FS cache related surprises are potentially possible ;-))
    • etc..
    • I'd say the HW-based "atomic IO writes" solution is looking as the most strong.. -- but we're working here as well to bring yet more possible options, so stay tuned ;-))

  • purge -- a kind of "garbage collector" in InnoDB, running in background, can be configured with several "purge threads", however you may still see it lagging in your RW workload (can be observed as a growing or remaining high "History List" via "show engine innodb status" or via InnoDB METRICS table) -- the problem with constantly lagging purge is that your data space can be finally completely filled up with a "trash", and your whole database processing will be stopped due no more free disk space available.. The good news with MySQL 5.7 that if even purge is lagging during a high load, it'll be still able to catch up once the load become low and "auto-magically" free the disk space used by UNDO images (this is available only since MySQL 5.7, and in all previous versions the only solution to get all this disk space back was to drop the whole InnoDB instance and restore it from a backup or import from a dump).. -- so, it's important to configure several purge threads to make such a space recovery faster (innodb_purge_threads=4)

  • adaptive flushing -- I'll not go too much in details here as the topic is extremely interesting and worth a dedicated article about, so here will just mention that since MySQL 5.7 you can have several "flushing threads" (cleaners) working in parallel -- the initial analyze about what is going odd was made yet more than 3 years ago with MySQL 5.6 (see: http://dimitrik.free.fr/blog/archives/2012/10/mysql-performance-innodb-buffer-pool-instances-in-56.html for details) -- however this was only the first step in this adventure, and a more advanced design was required ;-)) -- well, we're not yet "perfect" here, yet more to come, will just mention here that using 4 threads is usually ok (innodb_page_cleaners=4), then the IO capacity setting should be adapted to your workload and your storage (ex. innodb_io_capacity=2000 innodb_io_capacity_max=10000), and there is no more danger to use bigger REDO log files (recovery processing is going much more faster now than before, as well only a "really needed" REDO space is used, as well a previously existing "read-on-write" issue on REDO logs was fixed since MySQL 5.7, so using 8GB REDO, or bigger is no more a problem (innodb_log_file_size=1024M innodb_log_files_in_group=8) -- well, sorry to skip the details here, will provide them all later..

  • checksums -- as soon as you're using crc32 option, you're fine ;-)) however, keep in mind that this is not impacting your scalability limits, this is a pure "overhead" (your performance levels will still scale with the same tendency, just that the response times will be higher)..

  • there are some other points/tuning/etc. are coming in the game as well, but let's keep the list short just with the most important ones ;-))

After all this "preface", let's focus now on the OLTP_RW benchmark testing (hope it was not too much boring until now ;-))

So far, my main goal on the following testing is to mainly analyze the scalability of MySQL 5.7 on OLTP_RW workload :
  • means, I don't need a too big database (I'm not testing the storage here ;-))
  • so, the dataset should be :
    • not too small to run fully on CPU caches level ;-))
    • and not too big either to not involve IO reads (otherwise, again, we're testing the storage performance ;-))

My HW platform :
  • for my tests I'll use the 72cores-HT server running OracleLinux-7.2 and having flash storage
  • why 72cores ?..
  • in fact this is a 4CPU sockets server (18cores-HT per CPU socket)
  • so, I can easily test scalability on 1CPU (18cores-HT), 2CPU (36cores-HT) and 4CPU (72cores-HT) by binding my MySQL server to run exclusively on these CPU cores..
  • then, these CPUs are the latest CPU chips from Intel, they are really way more powerful comparing to what I have on my older machines..
  • and this is where the whole HW tendency is going -- you'll see these CPUs on all "big" and "commodity" HW, and even 18cores-HT per CPU is not a limit either, so there are really fun times are coming (and if you're still thinking that "commodity" HW is a host with 4cores -- it's a good time to wake up ;-))

While my main interest here is about MySQL 5.7, I'm also curious to see what are the limits on the other MySQL Engines as well, and I have the following on my list :

MySQL Engines :
  • MySQL 5.7
  • MySQL 5.6
  • MySQL 5.5
  • Percona Server 5.6
  • MariaDB 10.1

Test Scenario :
  • from the previous OLTP_RO test I've already observed that all engines are worse vs MySQL 5.7 when a single table only is used in OLTP test.. -- so, no need to waste a time again to point to the same problem..
  • let's focus then on x8-tables OLTP_RW Sysbench test workload, each table of 1M
  • before each test the database is completely restored from its backup (clean dataset for each test)
  • the load is progressively growing from 8, 16, 32, .. up to 1024 concurrent users
  • each load level is kept at least for 5min (was enough to get an understanding about scalability limits, while I'd prefer more longer steps, while in the current case there was no way to run more longer iterations, as to cover all planned test conditions the whole testing already took over 2 weeks non-stop running ;-))
  • each MySQL Engine is tested within the following configurations :
    • trx2 -- innodb_flush_log_at_trx_commit=2 && innodb_doublewrite=0 (default)
    • trx1 -- innodb_flush_log_at_trx_commit=1 && innodb_doublewrite=0
    • trx1-dblwr1 -- innodb_flush_log_at_trx_commit=1 && innodb_doublewrite=1
  • each configuration is also tested with the following tuning combinations :
    • ccr0-sd6 -- innodb_thread_concurrency=0 (default) && innodb_spin_wait_delay=6 (default)
    • ccr64-sd6 -- innodb_thread_concurrency=64 && innodb_spin_wait_delay=6
    • ccr0-sd6 -- innodb_thread_concurrency=0 && innodb_spin_wait_delay=96
    • ccr64-sd6 -- innodb_thread_concurrency=64 && innodb_spin_wait_delay=96
  • and, finally, all configurations + all tuning combinations are tested on 1, then 2, then 4 CPU sockets (18cores-HT, 36cores-HT, 72cores-HT)..
  • the best obtained results for each Engine from any tested combinations then used to compare performance in different configurations (best-to-best comparison)..

I think I need to explain here a little bit more in details the impact of the mentioned tuning options :

  • thread_concurrency : a well known InnoDB tuning to limit the amount of concurrently running threads (usually no more required since MySQL 5.7 for RO workloads, but still helping for RW -- as we're writing and for sure will involve IO operations + manage various raw/data locking (via mutexes/RW-locks, etc.) -- there is still a significant benefit possible with an "optimal" thread concurrency limitation. Which setting could you consider optimal?.. -- I'd say you need to analyze which peak performance level you're reaching on your workload without concurrency limit (innodb_thread_concurrency=0) and see how many concurrent user sessions are running during this period -- this will be then your main concurrency target (by not allowing more than N concurrent threads you'll be able to keep your performance stable even with a higher load (well, at least not to see it quickly going down ;-)) -- in my cases the most optimal setting was 64 until now (innodb_thread_concurrency=64), while in your case it may be something different as well (this tuning is fully dynamic, so you may do live experiments on any running workload at any time you want ;-))

  • spin_delay : and this tuning is directly related to how internal lock primitives (mutexes/RW-locks) are "spinning" on a lock wait (threads waiting on a lock will "sleep" a given delay between spins before to re-try to acquire a lock again) -- the important point here is that a waiting thread in InnoDB will not really "sleep" on delay, but rather execute a "pause" instruction to CPU, so the CPU will switch to execute another thread(s), and waiting thread will come back as soon as its "pause" is finished (for this reason "show mutex" output about mutex/RW-locks spins/waits is better reflecting as for today InnoDB internal waits stats (as the time spent on a wait is not really wasted)). The question is then which value will be the most optimal here?.. -- again, you can get it only by testing by yourself ;-)) (this tuning is also dynamic) -- the 6 is default value, and I'm usually using 96 (innodb_spin_wait_delay=96) for big enough systems. Again, for RO workloads since MySQL 5.7 it's no more required, while for RW workloads we'll hit log_sys mutex contention for sure, and such a tuning usually may help.. The only problem here is that this setting is applied to all lock primitives together, so you really need to do experiments yourself to see what is better for you. However, by getting rid of hot contentions with every new improvement in InnoDB, we're progressively making the need of such a tuning obsolete.. (work in progress, stay tuned ;-))

Now, let me show the impact of this tuning by example :
  • the following graph is representing MySQL 5.7 results on OLTP_RW test
  • there are 4 results for the same MySQL 5.7, just with different concurrency/spin_delay tuning settings: ccr=0 / 64, sd=6 / 96


Observations :
  • as you can see, tuning the spin_delay for this Engine in this workload giving the most important impact..
  • with spin_delay=6 (sd6) we're getting a better performance up to 64 concurrent users
  • however with spin_delay=96 (sd96) we're going more far up to 128 users, and then able to keep near the same level of performance on a higher load as well..
  • interesting that in this case tuning thread concurrency helps only for sd6 setting, and has no impact on sd96
  • (but by the past experience I know it helps a lot on IO-bound workloads, so no reason to not test it ;-))

The same tuning was applied to all other Engines, and then the best obtained results collected (Max(QPS) or Max(TPS)) for each test case.

Now, if you're curious, let me show you yet few more details about :
  • so, the next following graphs is representing "live" stats data corresponding to the obtained above results
  • from the left to the right you can see 4 tests with the same MySQL 5.7, but configured with :
    • #1) sd6, ccr0
    • #2) sd6, ccr64
    • #3) sd96, ccr0
    • #4) sd96, ccr64
  • the first graph is showing reached Commit/sec rate (TPS)
  • the second one is the amount of concurrent user sessions
  • and the third graph is showing corresponding mutex/RW-locks spin waits reported by InnoDB :