Tuesday, November 27, 2012

mydumper & myloader : fast backup and restore

mydumper & myloader : fast backup and restore


Lately we gave a try to mydumper as an alternative to mysqldump, and results are quite promising.
We found that mydumper performs very fast exporting both small and large datasets!!
We also found that the with large datasets restore with myloader doesn't perform a lot better than simple restore from mysqldump SQL dump: this depends from the storage engine and not from the client used to restore.
On a box we run 2 tests:
1) with a dataset that was fitting in the InnoDB buffer pool;
2) with a dataset larger than the InnoDB buffer pool.

TEST #1

We created 128 tables of 1M rows each, for a total dataset of 31GB on disk:
shell$ time ./sysbench --test=tests/db/parallel_prepare.lua --oltp-tables-count=128 --oltp-table-size=1000000 --mysql-table-engine=innodb --mysql-user=root --num-threads=12 run real 22m0.013s
user 204m22.054s
sys 0m37.430s
Doing the backup with mydumper:
shell$ time ./mydumper -t 8 -B sbtest
real 0m29.807s
user 2m35.111s
sys 0m26.102s
... and with mysqldump:
shell$ time mysqldump --single-transaction sbtest > sbtest.sql
real 6m24.607s
user 5m19.355s
sys 0m46.761s
Within this test, mydumper looks around 13 times faster than mysqldump.
We also tried compression, but I/O was fast enough to make compression only an unnecessary overhead: in other words, on that hardware and with this dataset, mydumper with compression was slower than mydumper without compression.
To complete the test, we tried recovery time, after deleting and recreating and empty database:
shell$ mysql -e "drop database sbtest ; create database sbtest"
shell$ time ./myloader -t 8 -d export-20110720-090954
real 9m12.548s
user 0m55.193s
sys 0m28.316s

shell$ mysql -e "drop database sbtest ; create database sbtest"
shell$ time ( echo "SET SQL_LOG_BIN=0;" ; cat sbtest.sql ) | mysql sbtest
real 46m46.140s
user 9m3.604s
sys 0m48.256s
With this dataset, restore time using myloader was 5 times faster than using the SQL dump from mysqldump.

TEST #2

Test #2 is very similar to test #1 , but with some different in the dataset:
48 tables instead of 128 tables;
10M rows on each table instead of 1M rows;
a total dataset on disk of 114GB instead of 31GB.

First, we created the tables with sysbench:
shell$ time ./sysbench --test=tests/db/parallel_prepare.lua --oltp-tables-count=48 --oltp-table-size=10000000 --mysql-table-engine=innodb --mysql-user=root --num-threads=12 run
real 107m24.657s
user 689m2.852s
sys 2m11.980s

Backup with mydumper:
shell$ time ./mydumper -t 8 -B sbtest
real 7m42.703s
user 15m14.873s
sys 2m20.203s

The size of the backup is quite big because not compressed: 91GB
On average, mydumper was writing on disk at around 200MB/s.
Backup with mysqldump:
shell$ time mysqldump --single-transaction sbtest > sbtest.sql
real 32m53.972s
user 20m29.853s
sys 2m47.674s

mydumper was again faster than mysqldump , but not as much as in the previous test: only 4 times faster.
Was now the time to measure recovery time:
shell$ mysql -e "drop database sbtest ; create database sbtest"
shell$ time ./myloader -t 6 -d export-20110720-171706
real 130m58.403s
user 4m5.209s
sys 1m51.801s

shell$ mysql -e "drop database sbtest ; create database sbtest"
shell$ time ( echo "SET SQL_LOG_BIN=0;" ; cat sbtest.sql ) | mysql sbtest
real 204m18.121s
user 34m33.520s
sys 3m43.826s

myloader is just a bit more than 50% times faster than importing the SQL dump from mysqdump
Conclusion from second test:
a) With larger dataset, mydumper slows down because the system does more I/O as the dataset doesn't fit in memory, but still way faster than mysqldump.
b) With larger dataset, load time with myloader slowed down a lot. Although, the root cause of the performance drop isn't mydumper , but:
- more I/O (dataset + dump don't fit in RAM);
- InnoDB inserts rate degenerates with bigger tables.

On the topic of InnoDB inserts rate degeneration with big tables , probably another blog post will follow.
Notes on hardware and configuration:
CPU: 2 x 6cores with HT enabled
96 GB of RAM
FusionIO

innodb_buffer_pool_size=64G
innodb_log_file_size=2047M
innodb_io_capacity=4000
innodb_flush_log_at_trx_commit=2
(binlog disabled)
Tuesday, November 20, 2012

10 MySQL variables that you should monitor


Regardless of whether you're running a single MySQL server or a cluster of multiple servers, one thing you are always interested in is squeezing the maximum performance out of your system. MySQL's developers were well aware of this, and so they provided a fairly comprehensive list of performance variables that you can monitor in real time to check the health and performance of your MySQL server.

These variables are accessible via the SHOW STATUS command. In Table A, we've listed 10 of the most important performance variables you should monitor when using MySQL, and we explain which particular attribute each of them reflects.

Table A

Variable
What it represents
Why you should monitor it
Threads_connected
This variable indicates the total number of clients that have currently open connections to the server.
It provides real-time information on how many clients are currently connected to the server. This can help in traffic analysis or in deciding the best time for a server re-start.
Created_tmp_disk_tables
This variable indicates the number of temporary tables that have been created on disk instead of in-memory.
Accessing tables on disk is typically slower than accessing the same tables in memory. So queries that use the CREATE TEMPORARY TABLE syntax are likely to be slow when this value is high.
Handler_read_first
This variable indicates the number of times a table handler made a request to read the first row of a table index.
If MySQL is frequently accessing the first row of a table index, it suggests that it is performing a sequential scan of the entire index. This indicates that the corresponding table is not properly indexed.
Innodb_buffer_pool_wait_free
This variable indicates the number of times MySQL has to wait for memory pages to be flushed.
If this variable is high, it suggests that MySQL's memory buffer is incorrectly configured for the amount of writes the server is currently performing.
Key_reads
This variable indicates the number of filesystem accesses MySQL performed to fetch database indexes.
Performing filesystem reads for database indexes slows query performance. If this variable is high, it indicates that MySQL's key cache is overloaded and should be reconfigured.
Max_used_connections
This variable indicates the maximum number of connections MySQL has had open at the same time since the server was last restarted.
This value provides a benchmark to help you decide the maximum number of connections your server should support. It can also help in traffic analysis.
Open_tables
This variable indicates the number of tables that are currently open.
This value is best analyzed in combination with the size of the table cache. If this value is low and the table_cache value is high, it's probably safe to reduce the cache size without affecting performance. On the other hand, if this value is high and close to the table_cache value, there is benefit in increasing the size of the table cache.
Select_full_join
This variable indicates the number of full joins MySQL has performed to satisfy client queries.
A high value indicates that MySQL is being forced to perform full table joins (which are performance-intensive) instead of using indexes. This suggests a need for greater indexing of the corresponding tables.
Slow_queries
This variable indicates the number of queries that have taken longer than usual to execute.
A high value indicates that many queries are not being optimally executed. A necessary next step would be to examine the slow query log and identify these slow queries for optimization.
Uptime
This variable indicates the number of seconds since the server was last restarted.
This value is useful to analyze server uptime, as well as to generate reports on overall system performance. A consistent low value indicates that the server is being frequently restarted, thereby causing frequent interruptions to client service.

Monday, November 19, 2012

Performance Monitor for MySQL?

Performance Monitor for MySQL?

The FromDual Performance Monitor (mpm) for MySQL, Galera Cluster/MySQL, Percona Server and MariaDB is a Monitoring Solution based on the Enterprise open source Monitor Zabbix.
It provides all the necessary modules to monitor MySQL performance metrics in detail an let you display them graphically.

Thus it is a good alternative to the MySQL Enterprise Monitor which is only available for paying Oracle/MySQL customers.

For more details see also our presentation at the OpenSQL Camp / FrOSCon 2010.
To stay tuned about the progress of the MySQL Performance Monitor follow us on Twitter.
We currently provide the following modules:
Further modules are available on request...

Prerequisites

On the Server where you want to install your monitoring service you need PHP, Apache and a database back-end (MySQL, PostgreSQL, Oracle or SQLite) installed.
Further you need a compile server to compile the Zabbix software.
On the Servers where you have your MySQL databases installed you need Perl and DBD::MySQL installed.

Download and Install

The most recent FromDual Performance Monitor for MySQL you can download from here...
This installation documentation should guide you through the installation process. It does NOT cover the installation of Zabbix. For installing Zabbix go through this installation guidelines first.
For more information and discussions about the mpm go to our Forum.

Considerations

Be careful using this Monitoring Software on production systems. We are not aware of any problem but its impact on MySQL databases is not know very well yet. Try it on testing systems first before using it in production.

Enterprise subscription and Support

For commercial use you have to purchase an Enterprise Subscription for the FromDual Performance Monitor. This subscription includes:
  • Notice of available updates for all modules.
  • Access to newest Releases of the MySQL Performance Monitor.
  • Best effort email support for all the FromDual modules. Contact our contact for getting support.
  • Opportunity to suggest enhancement requests.
The Enterprise subscription can be purchased here. This support does NOT contain Zabbix Support! Commercial support for Zabbix you can get from Zabbix directly.
If the installation of the MySQL Performance Monitor is part of a consulting engagement, the support for the first year is free.

Monitoring as a Service (MaaS)

If you do not want to take the burden to install the Monitor yourself we offer you Monitoring as a Service.

Demo

Some snapshots...

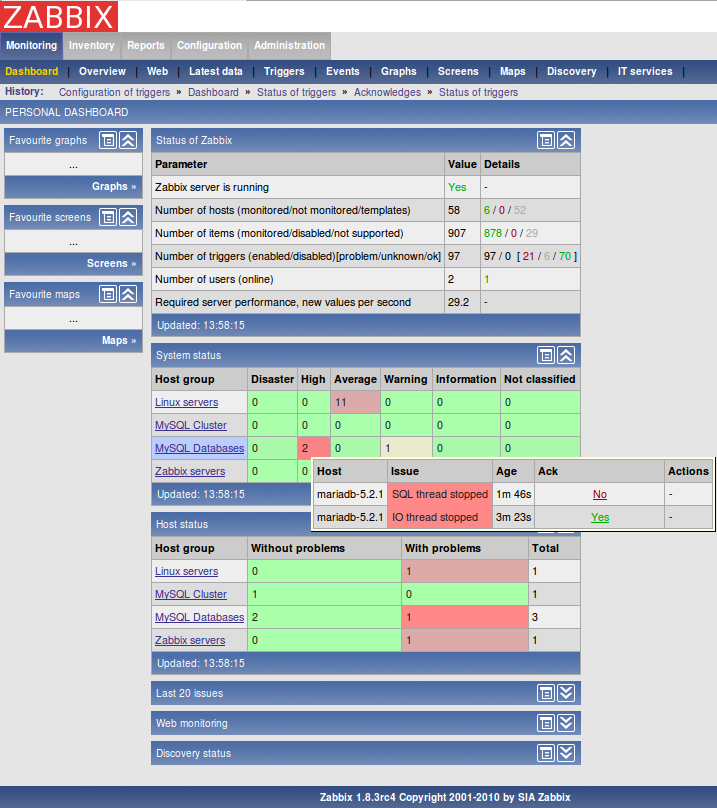
Dashboard with Slave issues

Dashboard with Slave issues

Triggers acknowledged

Triggers acknowledged

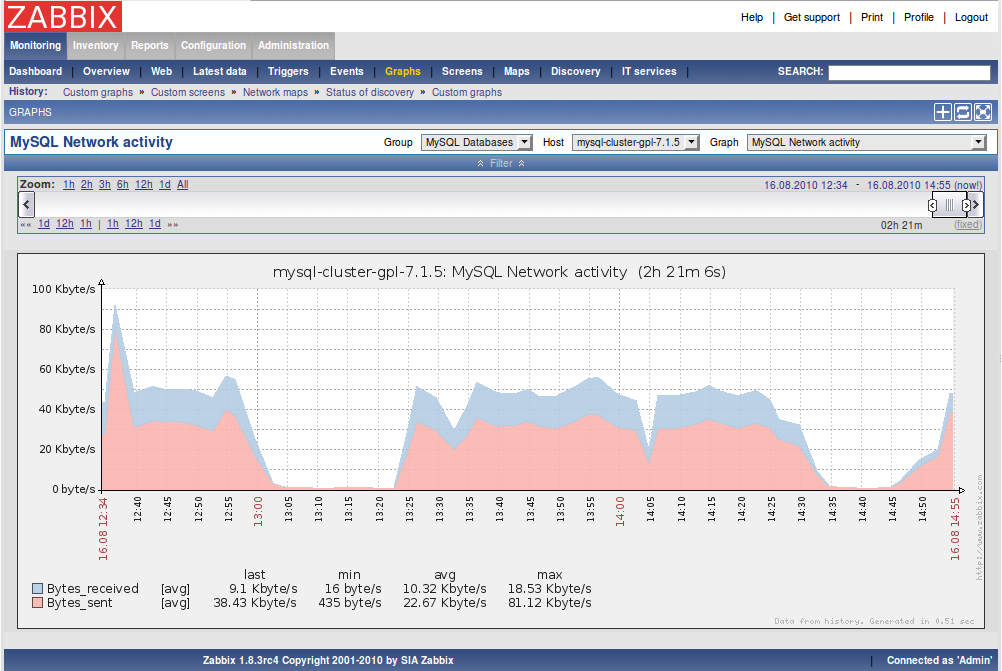
MySQL network activity

MySQL network activity

MySQL statements sent against the server

MySQL statements sent against the server

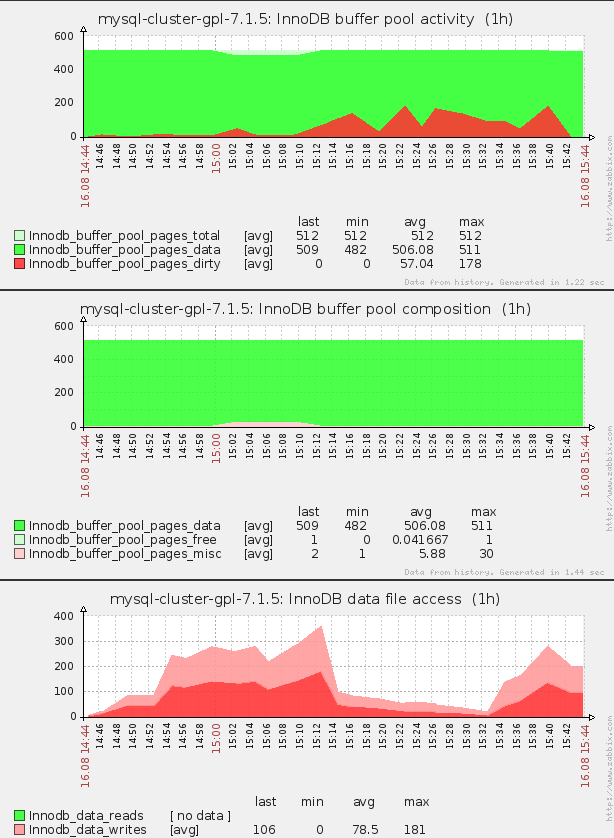
InnoDB buffer pool and data file activity

InnoDB buffer pool and data file activity

PBXT file writes

PBXT file writes

Friday, November 16, 2012

Using PERCONA pt-online-schema-change

Using pt-online-schema-change


Using pt-online-schema-change is a great way to change a table without downtime or switching over to a secondary database first.  While using it on production systems, we found some interesting issues to consider.

1) There were foreign_keys referencing the table we were altering.  There are two options to handle this.  They are specified with "--update-foreign-keys-method rebuild_constraints|drop_old_table".  One is to rebuild the tables with foreign keys.  This does lock the tables, and will block reads and writes while it is happening.  I chose to use drop_old_table.  This method disables foreign key checks, then drops the original table and renames the new table before reenabling foreign key checks.  Normally, pt-online-schema-change just renames the tables, then drops the old table, so locking is minimal.  We did find that there was locking while dropping the original table and renaming the new table.  This is something to be cautious with, especially with large tables.  In theory, you could run an online change to drop the foreign key constraints on the child tables prior to working on the parent table.

2) When testing, this ran in 15 minutes against an unladen database and took over 24 minutes against production.  You could add --sleep n, where n is a number of seconds, if you need it to add less load to production.

3) One limit we also saw is that pt-online-schema-change will only work on tables with at least one unique single column index, such as a single column primary key.  Often partitioned tables don't have a unique single column index.


Here is some of the output of a sample pt-online-schema-change...


## Install pt-online-schema-change and pre-requisites...
wget percona.com/get/pt-online-schema-change
chmod 755 pt-online-schema-change
yum install perl-DBI
yum install perl-DBD-MySQL

time ./pt-online-schema-change h=127.0.0.1,D=my_schema,t=my_table -P3306 --alter "add column signature varbinary(255) NULL DEFAULT NULL; add column signature_version varchar(4) NULL DEFAULT NULL" --child-tables fk_table1,fk_table2 --update-foreign-keys-method drop_old_table -pXXXX --bin-log
# 2011-10-14T03:20:28 ./pt-online-schema-change started
# 2011-10-14T03:20:28 USE `my_schema`
# 2011-10-14T03:20:28 Alter table my_table using temporary table __tmp_my_table
# 2011-10-14T03:20:28 Checking if table my_table can be altered
# 2011-10-14T03:20:28 SHOW TRIGGERS FROM `my_schema` LIKE 'my_table'
# 2011-10-14T03:20:28 Table my_table can be altered
# 2011-10-14T03:20:28 Chunk column id, index PRIMARY
# 2011-10-14T03:20:28 Chunked table my_table into 25685 chunks
# 2011-10-14T03:20:28 User-specified child tables: fk_table1, fk_table2
# 2011-10-14T03:20:28 Starting online schema change
# 2011-10-14T03:20:28 CREATE TABLE `my_schema`.`__tmp_my_table` LIKE `my_schema`.`my_table`
# 2011-10-14T03:20:28 ALTER TABLE `my_schema`.`__tmp_my_table` add column signature varbinary(255) NULL DEFAULT NULL
# 2011-10-14T03:20:29 ALTER TABLE `my_schema`.`__tmp_my_table`  add column signature_version varchar(4) NULL DEFAULT NULL
# 2011-10-14T03:20:30 Shared columns: id, col1, col2, col3, col4, col5
# 2011-10-14T03:20:30 Calling OSCCaptureSync::capture()
# 2011-10-14T03:20:30 CREATE TRIGGER mk_osc_del AFTER DELETE ON `my_schema`.`my_table` FOR EACH ROW DELETE IGNORE FROM `my_schema`.`__tmp_my_table` WHERE `my_schema`.`__tmp_my_table`.id = OLD.id
# 2011-10-14T03:20:30 CREATE TRIGGER mk_osc_upd AFTER UPDATE ON `my_schema`.`my_table` FOR EACH ROW REPLACE INTO `my_schema`.`__tmp_my_table` (id, col1, col2, col3, col4, col5) VALUES (NEW.id, NEW.col1, NEW.col2, NEW.col3, NEW.col4, NEW.col5)
# 2011-10-14T03:20:30 CREATE TRIGGER mk_osc_ins AFTER INSERT ON `my_schema`.`my_table` FOR EACH ROW REPLACE INTO `my_schema`.`__tmp_my_table` (id, col1, col2, col3, col4, col5) VALUES(NEW.id, NEW.col1, NEW.col2, NEW.col3, NEW.col4, NEW.col5)
# 2011-10-14T03:20:30 Calling CopyRowsInsertSelect::copy()
Copying rows:   1% 24:52 remain
Copying rows:   3% 25:01 remain
...
Copying rows:  96% 00:43 remain
Copying rows:  98% 00:15 remain
# 2011-10-14T03:44:14 Calling OSCCaptureSync::sync()
# 2011-10-14T03:44:14 Renaming foreign key constraints in child table
# 2011-10-14T03:44:14 SET foreign_key_checks=0
# 2011-10-14T03:44:14 DROP TABLE `my_schema`.`my_table`
# 2011-10-14T03:44:49 RENAME TABLE `my_schema`.`__tmp_my_table` TO `my_schema`.`my_table`
# 2011-10-14T03:44:49 Calling CopyRowsInsertSelect::cleanup()
# 2011-10-14T03:44:49 Calling OSCCaptureSync::cleanup()
# 2011-10-14T03:44:49 DROP TRIGGER IF EXISTS `my_schema`.`mk_osc_del`
# 2011-10-14T03:44:49 DROP TRIGGER IF EXISTS `my_schema`.`mk_osc_ins`
# 2011-10-14T03:44:49 DROP TRIGGER IF EXISTS `my_schema`.`mk_osc_upd`
# 2011-10-14T03:44:49 ./pt-online-schema-change ended, exit status 0

real    24m20.777s
user    0m3.936s
sys     0m1.216s

Comments

Yes, we also had similar issues with Percona Toolkit. But recently, we switched to Openark Kit and it works for our needs so far. Here is another issue with Percona Toolkit we faced: http://stackoverflow.com/questions/9187097/percona-toolkit-vs-openark-ki...

Thursday, November 15, 2012

‘query_cache_size’

‘query_cache_size’

MySQL Query Cache path

Just how effective is the Query Cache on performance? If you are not comfortable reading the MySQL code you can cheat very easily with the SHOW PROFILE command. This demonstration will show you at a high level the relative impact without and with the Query Cache. First let us confirm the Query Cache is not used.
mysql> SHOW GLOBAL VARIABLES LIKE 'query_cache%';
+------------------------------+---------+
| Variable_name                | Value   |
+------------------------------+---------+
| query_cache_limit            | 1048576 |
| query_cache_min_res_unit     | 4096    |
| query_cache_size             | 0       |
| query_cache_type             | ON      |
| query_cache_wlock_invalidate | OFF     |
+------------------------------+---------+
5 rows in set (0.00 sec)
We now enable profiling.
mysql> SET PROFILING=1;
We run our sample query.
mysql> select name,id,competitions from olympic_games where host_city='Sydney'\G
We can then enable the query cache and re-run the query.
mysql> SET GLOBAL query_cache_size=1024*1024*16;
mysql> select name,id,competitions from olympic_games where host_city='Sydney'\G
NOTE: We run the query twice after enabling the cache, the first time, the query is cached, the second time it is retrieved from the cache. Now let us look at the profiling information.
mysql> SHOW PROFILES;
+----------+------------+-------------------------------------------------------------------------+
| Query_ID | Duration   | Query                                                                   |
+----------+------------+-------------------------------------------------------------------------+
|        1 | 0.00096100 | select name,id,competitions from olympic_games where host_city='Sydney' |
|        2 | 0.00029700 | SET GLOBAL query_cache_size=1024*1024*16                                |
|        3 | 0.00837900 | select name,id,competitions from olympic_games where host_city='Sydney' |
|        4 | 0.00009500 | select name,id,competitions from olympic_games where host_city='Sydney' |
+----------+------------+-------------------------------------------------------------------------+

mysql> SHOW PROFILE SOURCE FOR QUERY 3;
+--------------------------------+----------+---------------------------+---------------+-------------+
| Status                         | Duration | Source_function           | Source_file   | Source_line |
+--------------------------------+----------+---------------------------+---------------+-------------+
| starting                       | 0.000033 | NULL                      | NULL          |        NULL |
| checking query cache for query | 0.000088 | send_result_to_client     | sql_cache.cc  |        1262 |
| Opening tables                 | 0.000025 | open_tables               | sql_base.cc   |        4482 |
| System lock                    | 0.000006 | mysql_lock_tables         | lock.cc       |         258 |
| Table lock                     | 0.000081 | mysql_lock_tables         | lock.cc       |         269 |
| init                           | 0.000037 | mysql_select              | sql_select.cc |        2350 |
| optimizing                     | 0.000016 | optimize                  | sql_select.cc |         772 |
| statistics                     | 0.000021 | optimize                  | sql_select.cc |         954 |
| preparing                      | 0.000021 | optimize                  | sql_select.cc |         964 |
| executing                      | 0.000005 | exec                      | sql_select.cc |        1648 |
| Sending data                   | 0.000500 | exec                      | sql_select.cc |        2190 |
| end                            | 0.000008 | mysql_select              | sql_select.cc |        2395 |
| query end                      | 0.000005 | mysql_execute_command     | sql_parse.cc  |        4821 |
| freeing items                  | 0.007489 | mysql_parse               | sql_parse.cc  |        5827 |
| storing result in query cache  | 0.000028 | query_cache_end_of_result | sql_cache.cc  |         813 |
| logging slow query             | 0.000007 | log_slow_statement        | sql_parse.cc  |        1628 |
| cleaning up                    | 0.000009 | dispatch_command          | sql_parse.cc  |        1595 |
+--------------------------------+----------+---------------------------+---------------+-------------+
17 rows in set (0.00 sec)

mysql> SHOW PROFILE SOURCE FOR QUERY 4;
+--------------------------------+----------+-----------------------+--------------+-------------+
| Status                         | Duration | Source_function       | Source_file  | Source_line |
+--------------------------------+----------+-----------------------+--------------+-------------+
| starting                       | 0.000035 | NULL                  | NULL         |        NULL |
| checking query cache for query | 0.000014 | send_result_to_client | sql_cache.cc |        1262 |
| checking privileges on cached  | 0.000010 | send_result_to_client | sql_cache.cc |        1346 |
| sending cached result to clien | 0.000026 | send_result_to_client | sql_cache.cc |        1441 |
| logging slow query             | 0.000005 | log_slow_statement    | sql_parse.cc |        1628 |
| cleaning up                    | 0.000005 | dispatch_command      | sql_parse.cc |        1595 |
+--------------------------------+----------+-----------------------+--------------+-------------+
6 rows in set (0.00 sec)
It does not take a rocket scientist to determine that 6 steps within the MySQL kernel is better then 17, regardless of what those steps are, and how different in timing they may be.
I’m not wanting to represent how much saving you may have here, there are many factors such as a realistic example, a loaded warmed up environment etc. You should try this in your own environment with your own queries.
This information was to provide an introduction into looking a little deeper at the Query Cache path within MySQL.